Series: ggplot From Zero
All articles in the "ggplot From Zero" series.
-
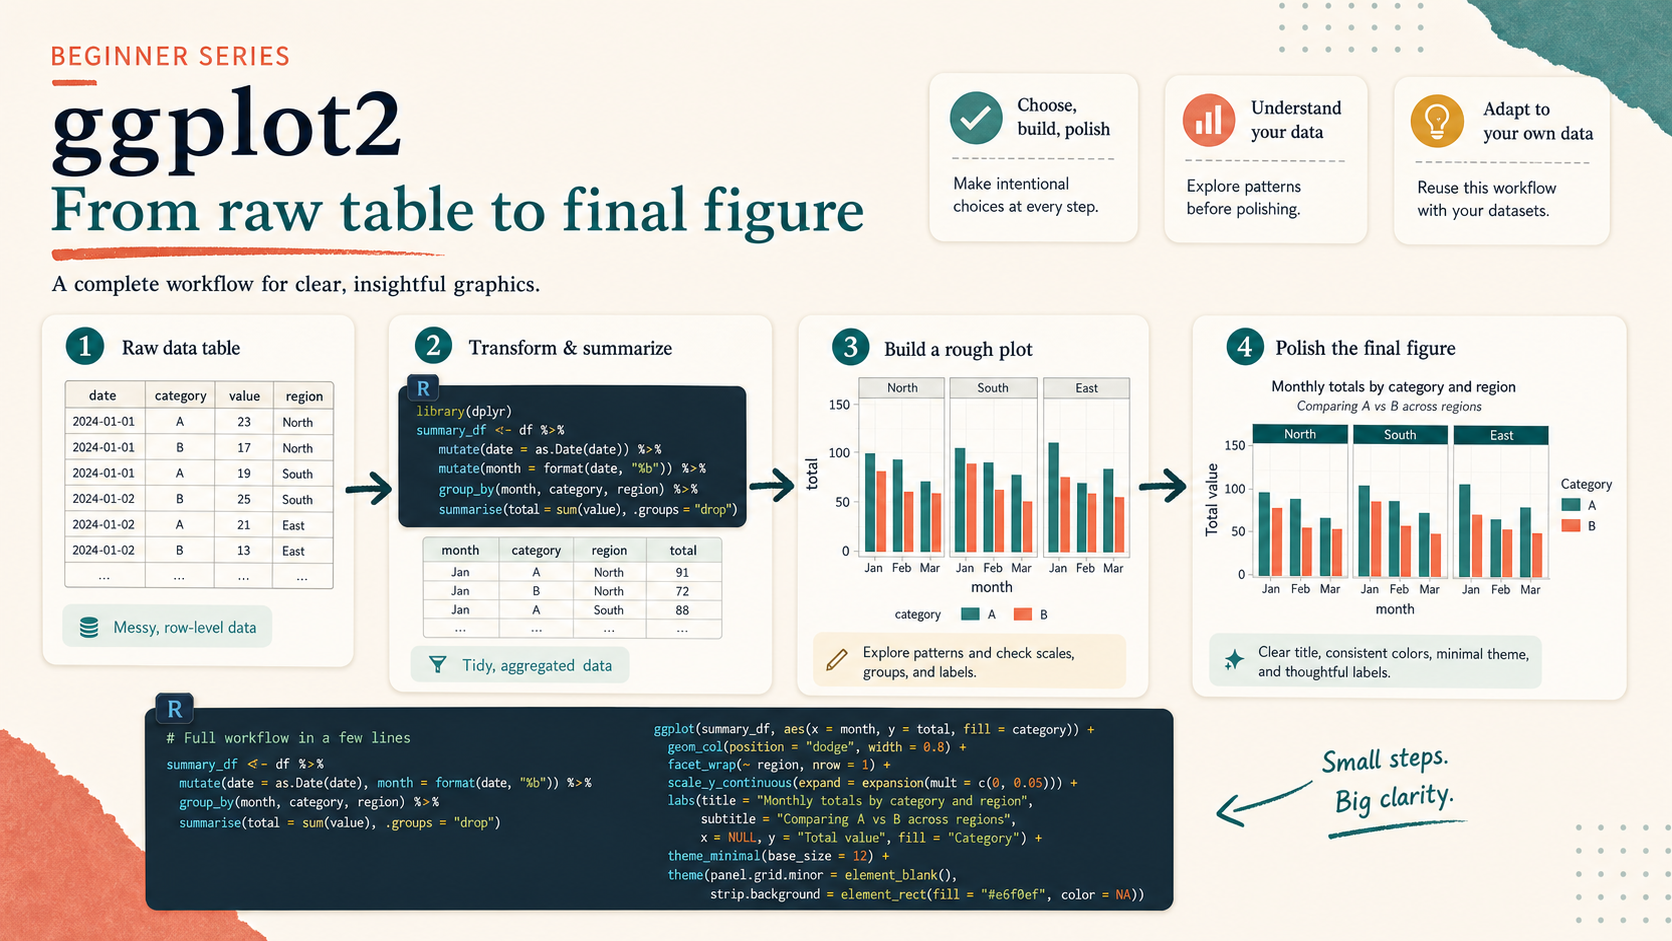
ggplot From Zero 08: A Full Workflow From Raw Table to Final Figure
Bring the series together by moving from a raw table to a final polished ggplot figure in a small bioinformatics-style workflow.
-
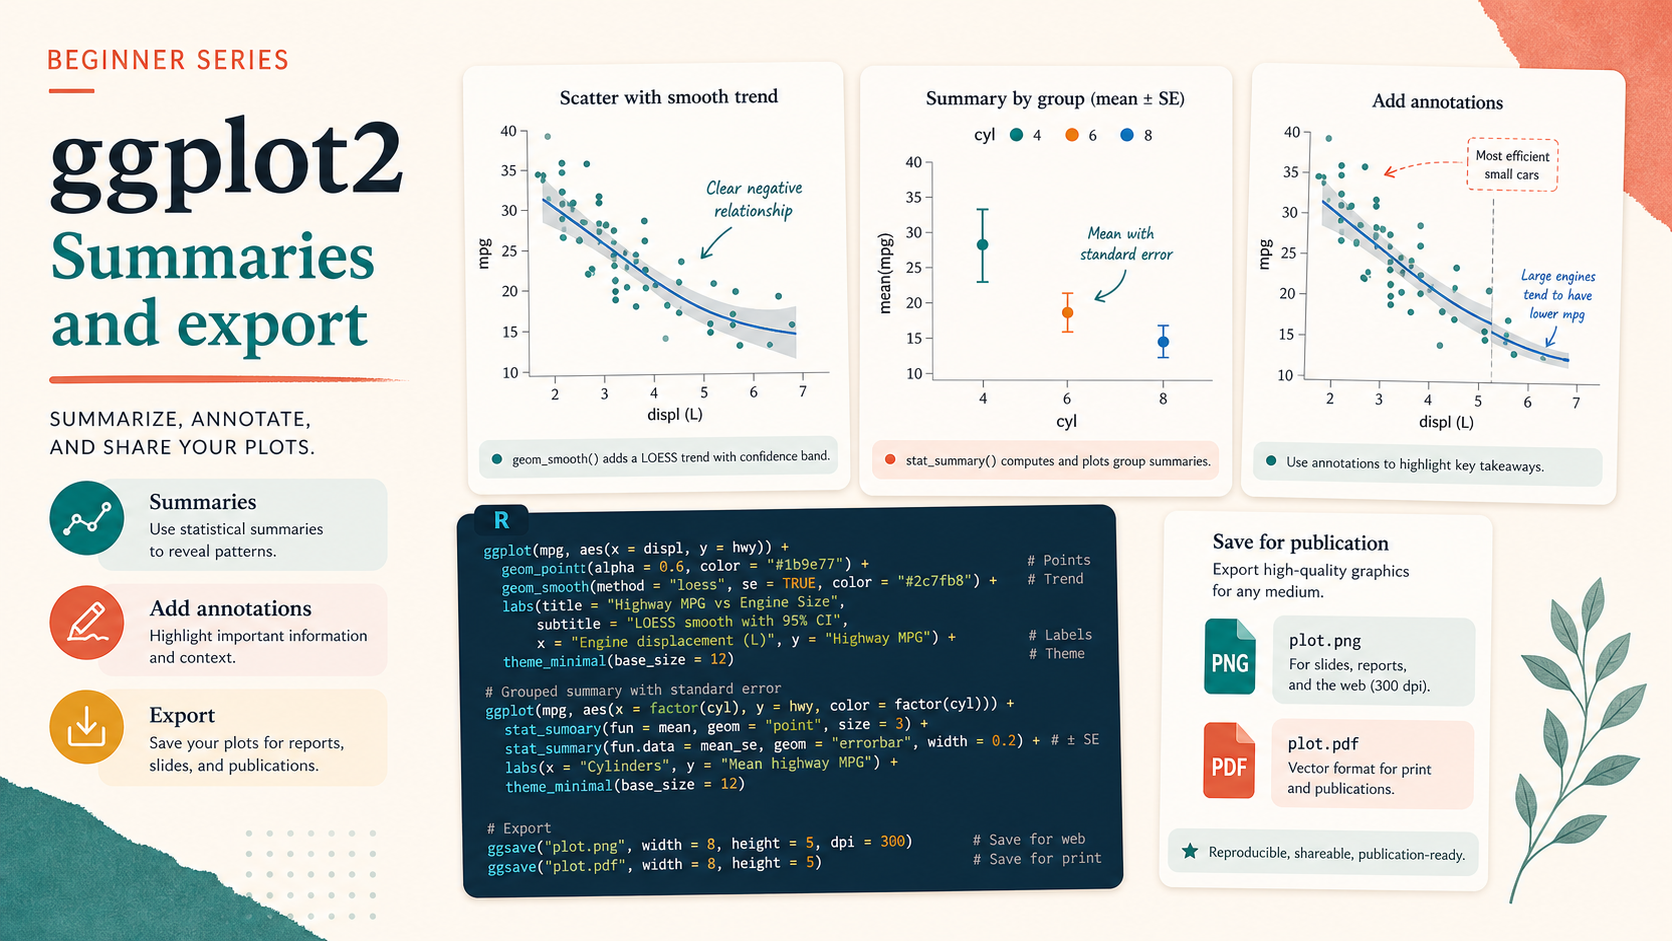
ggplot From Zero 07: Summaries, Annotations, and Export
Learn how to add summaries, annotations, and reproducible export settings so your ggplot figures are ready to share.
-
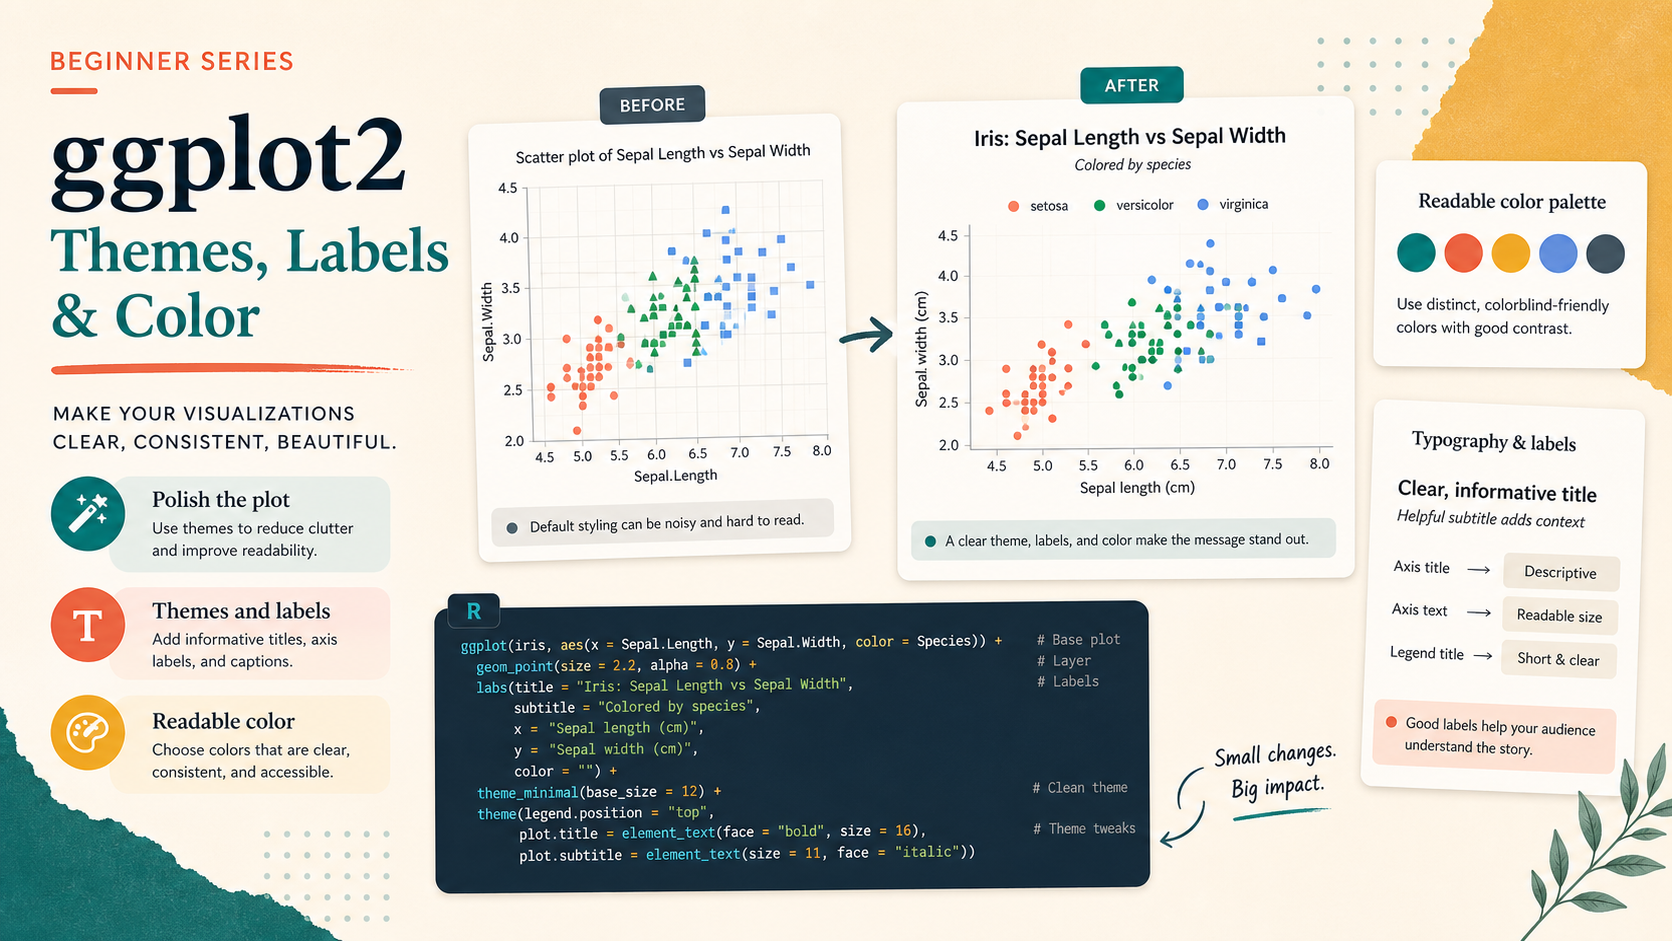
ggplot From Zero 06: Themes, Labels, and Color
Learn how to turn a working ggplot into a cleaner, more readable, and more publication-friendly figure with labels, themes, and color choices.
-
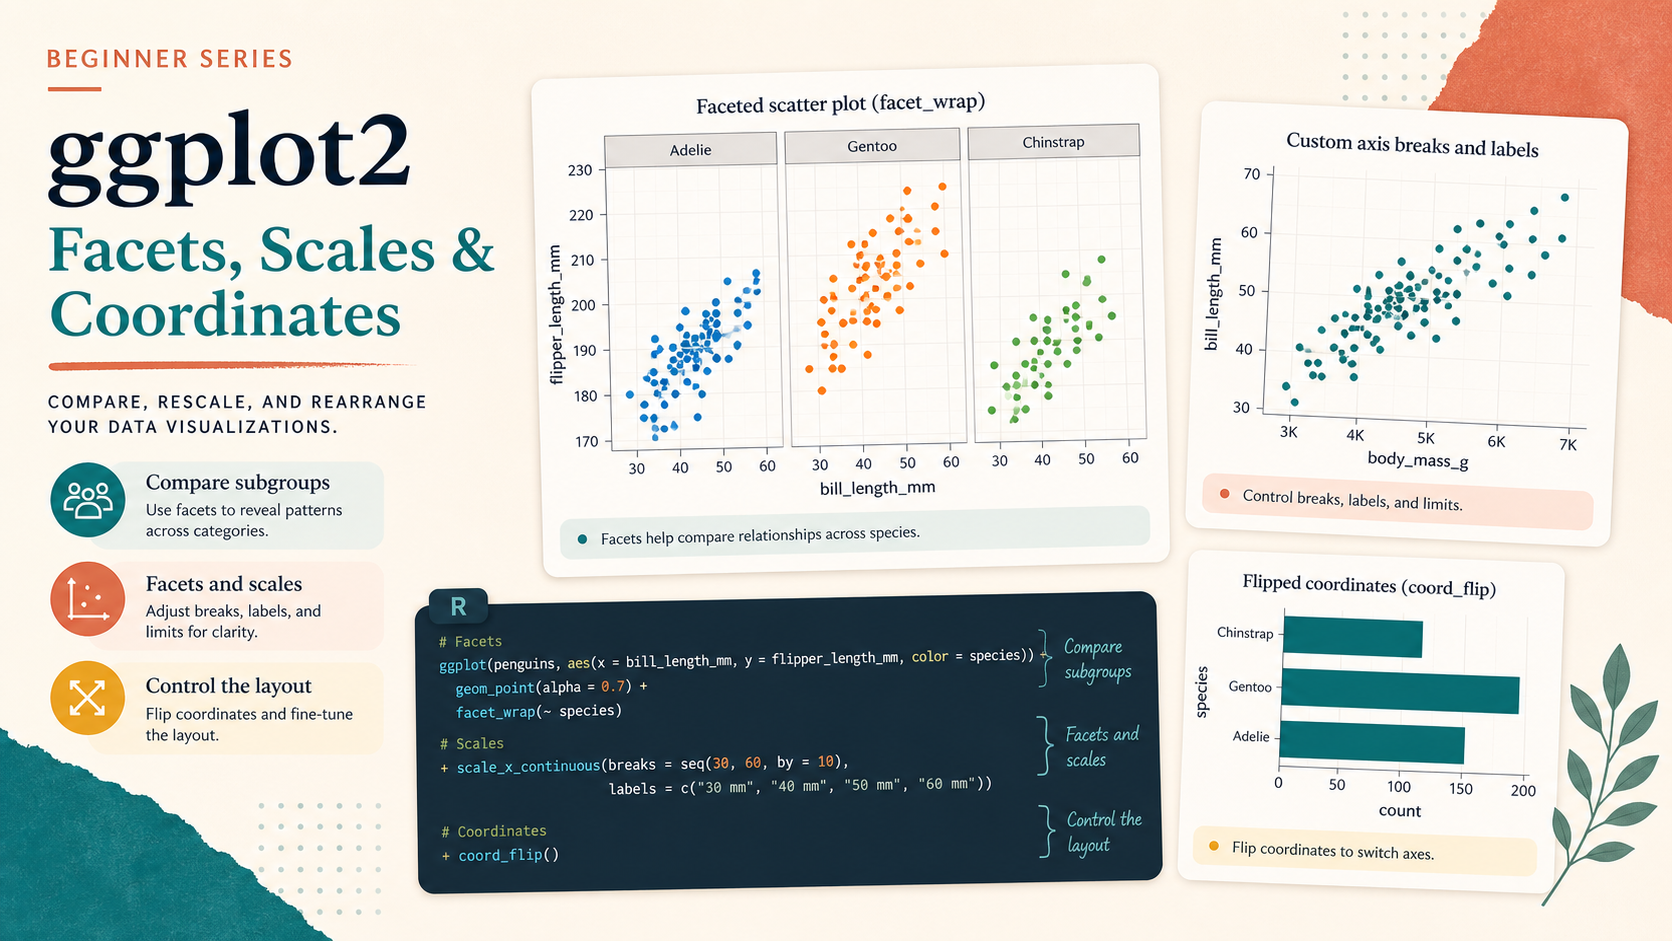
ggplot From Zero 05: Facets, Scales, and Coordinates
Learn how to split plots into panels, control scales, and adjust coordinate systems so comparisons become easier to read.
-
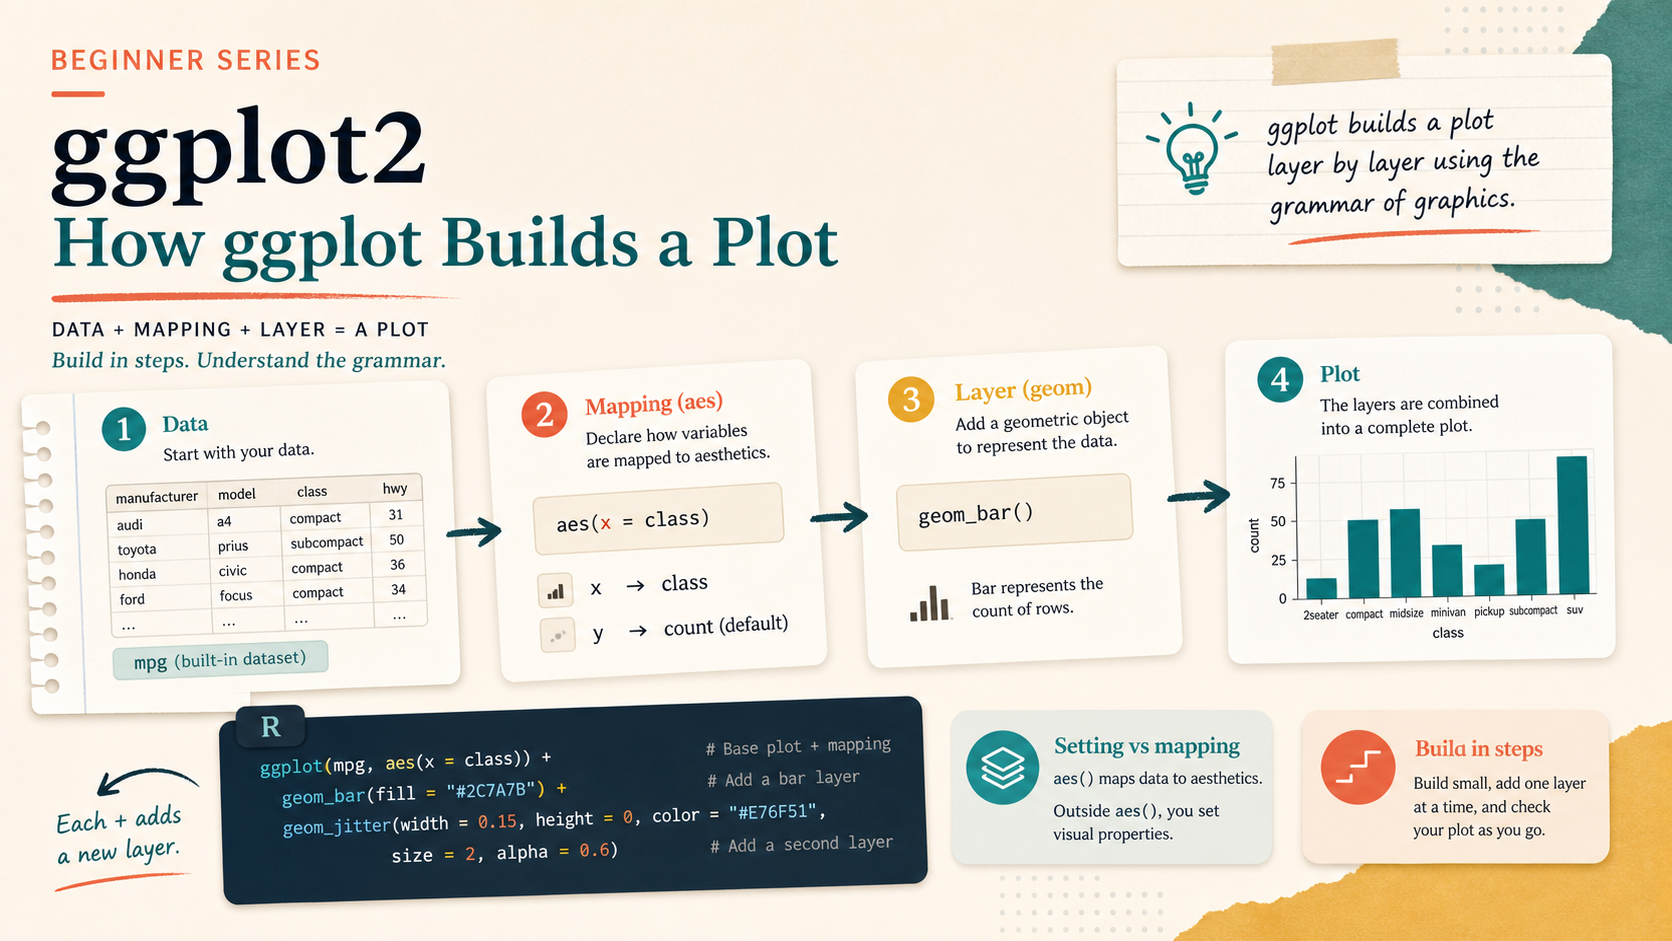
ggplot From Zero 04: How ggplot Builds a Plot
Learn the grammar behind ggplot2 by building plots layer by layer and comparing mapping, setting, and position adjustments.
-
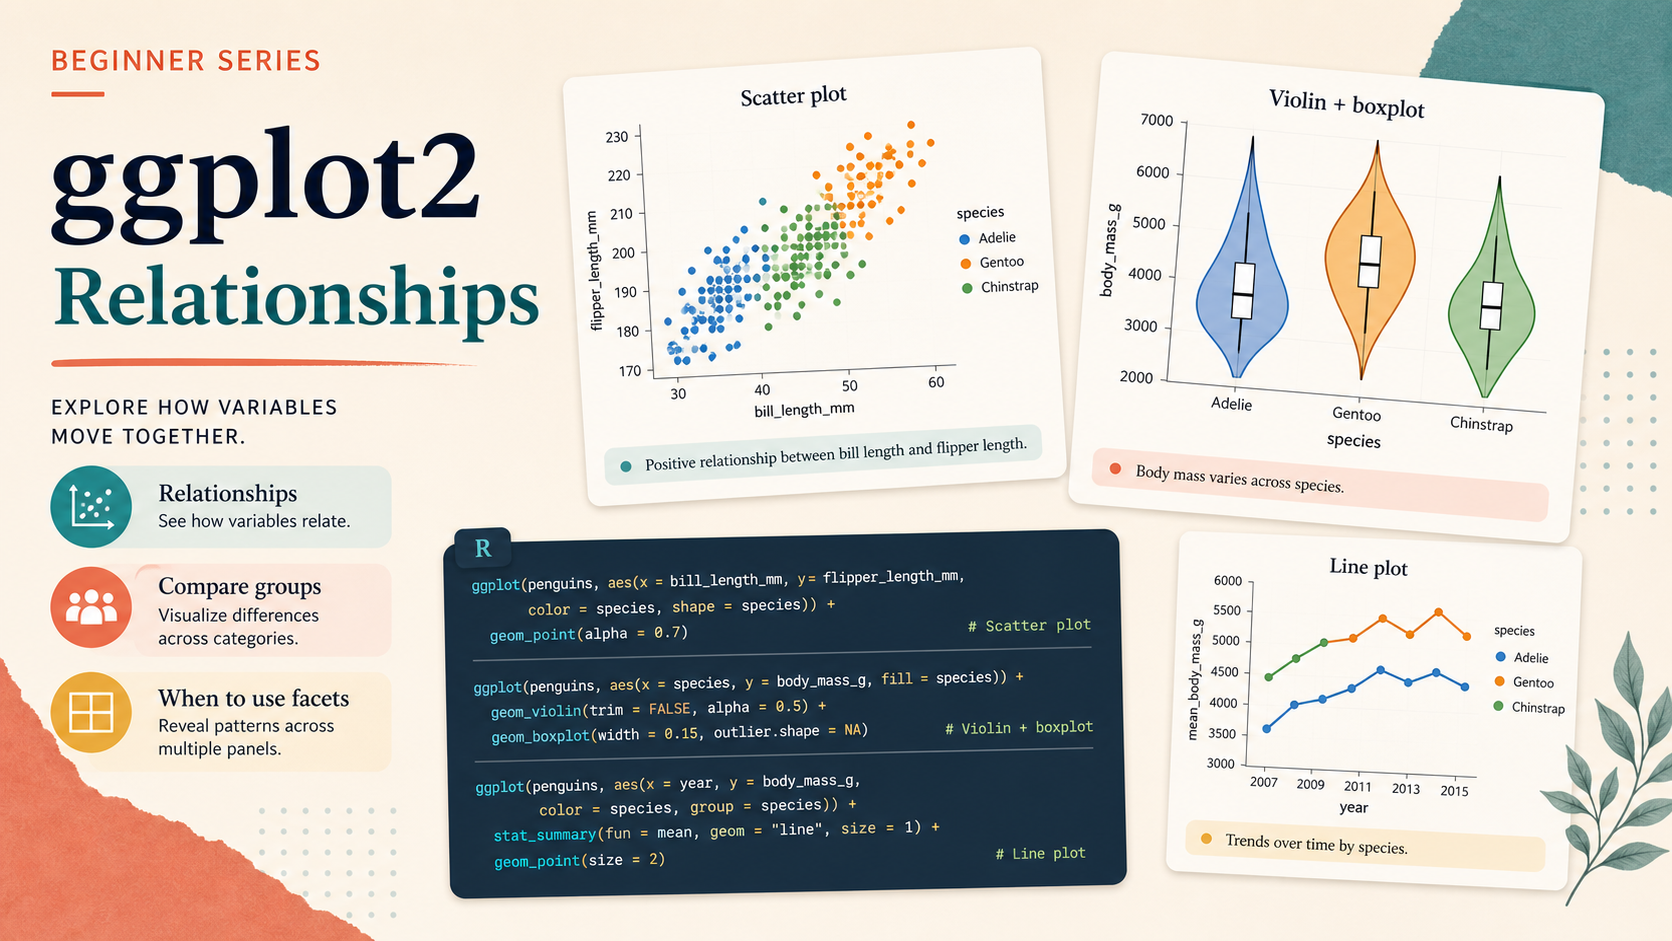
ggplot From Zero 03: Relationships Between Variables
Learn how to visualize relationships with scatter plots, boxplots, violin plots, and line plots in ggplot2.
-
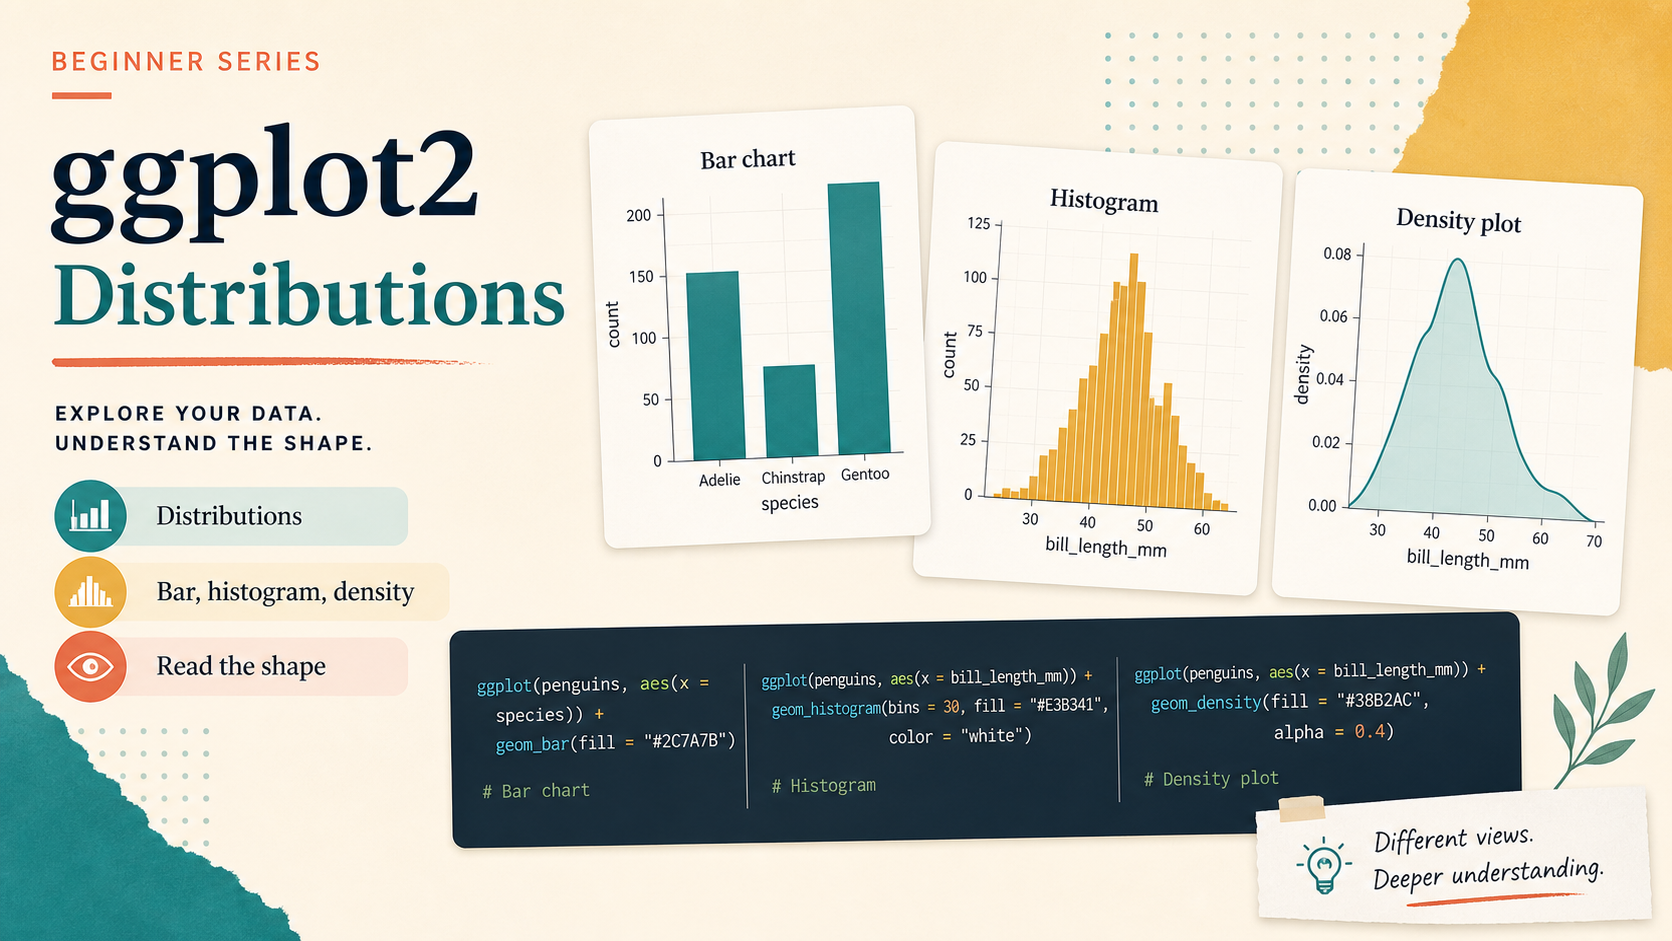
ggplot From Zero 02: Distributions
Learn how to choose between bar charts, histograms, and density plots when you want to show the distribution of one variable.
-
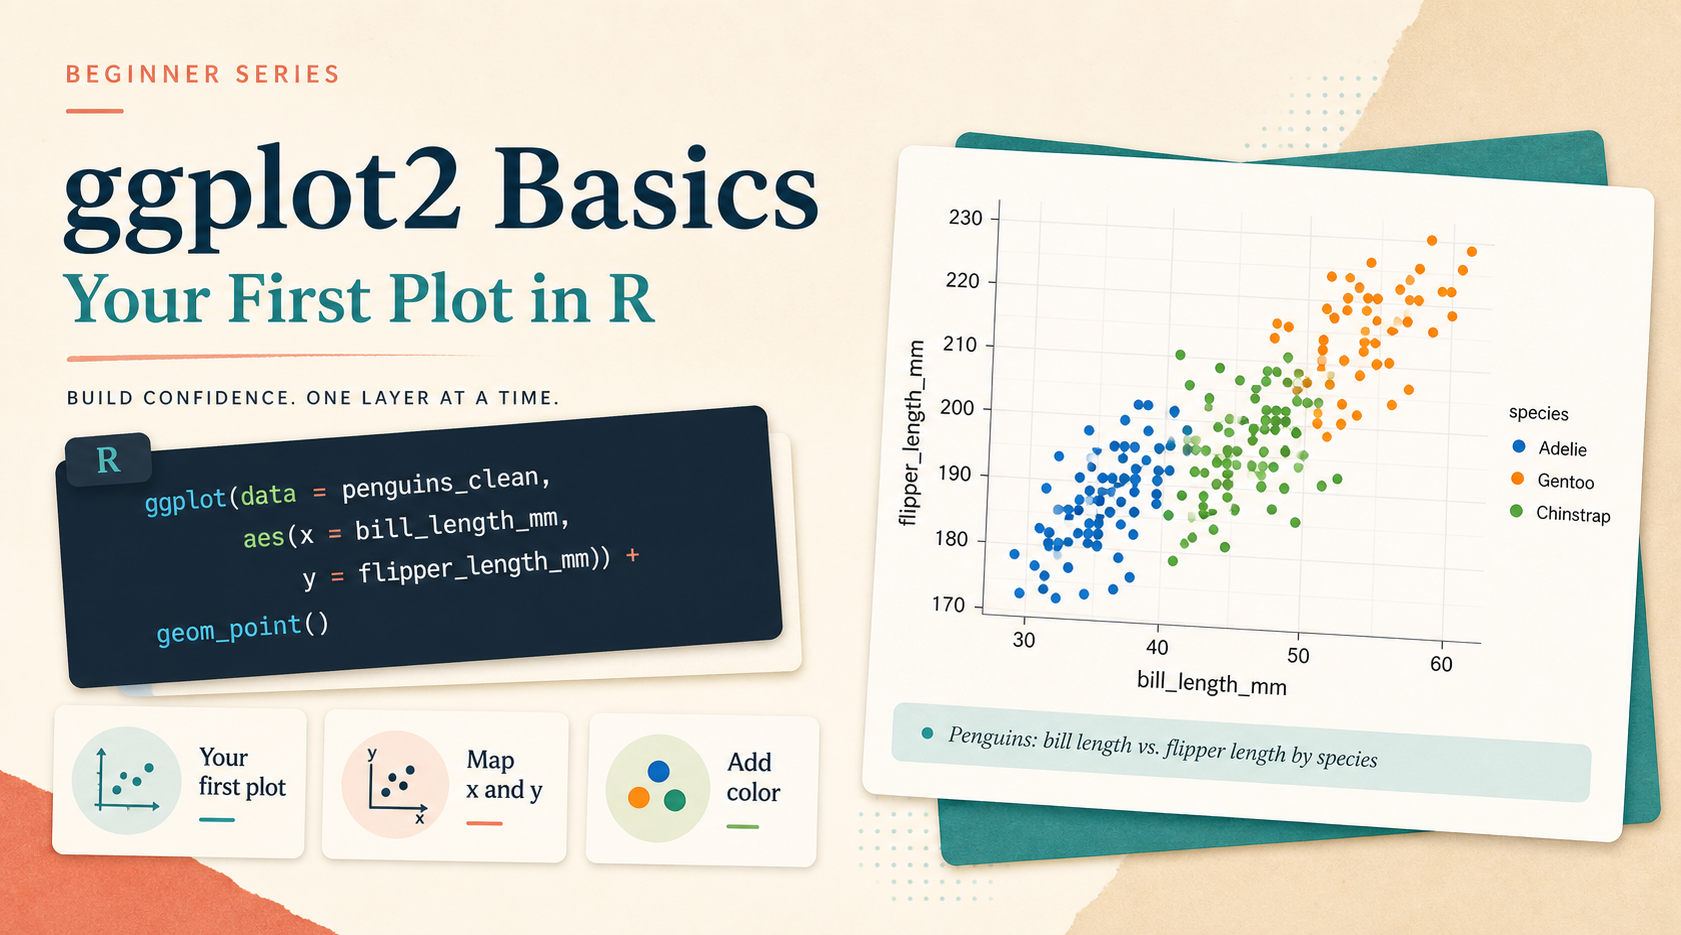
ggplot From Zero 01: Your First Plot
Learn the smallest working ggplot2 workflow by building your first scatter plot and then adding one more mapped variable.