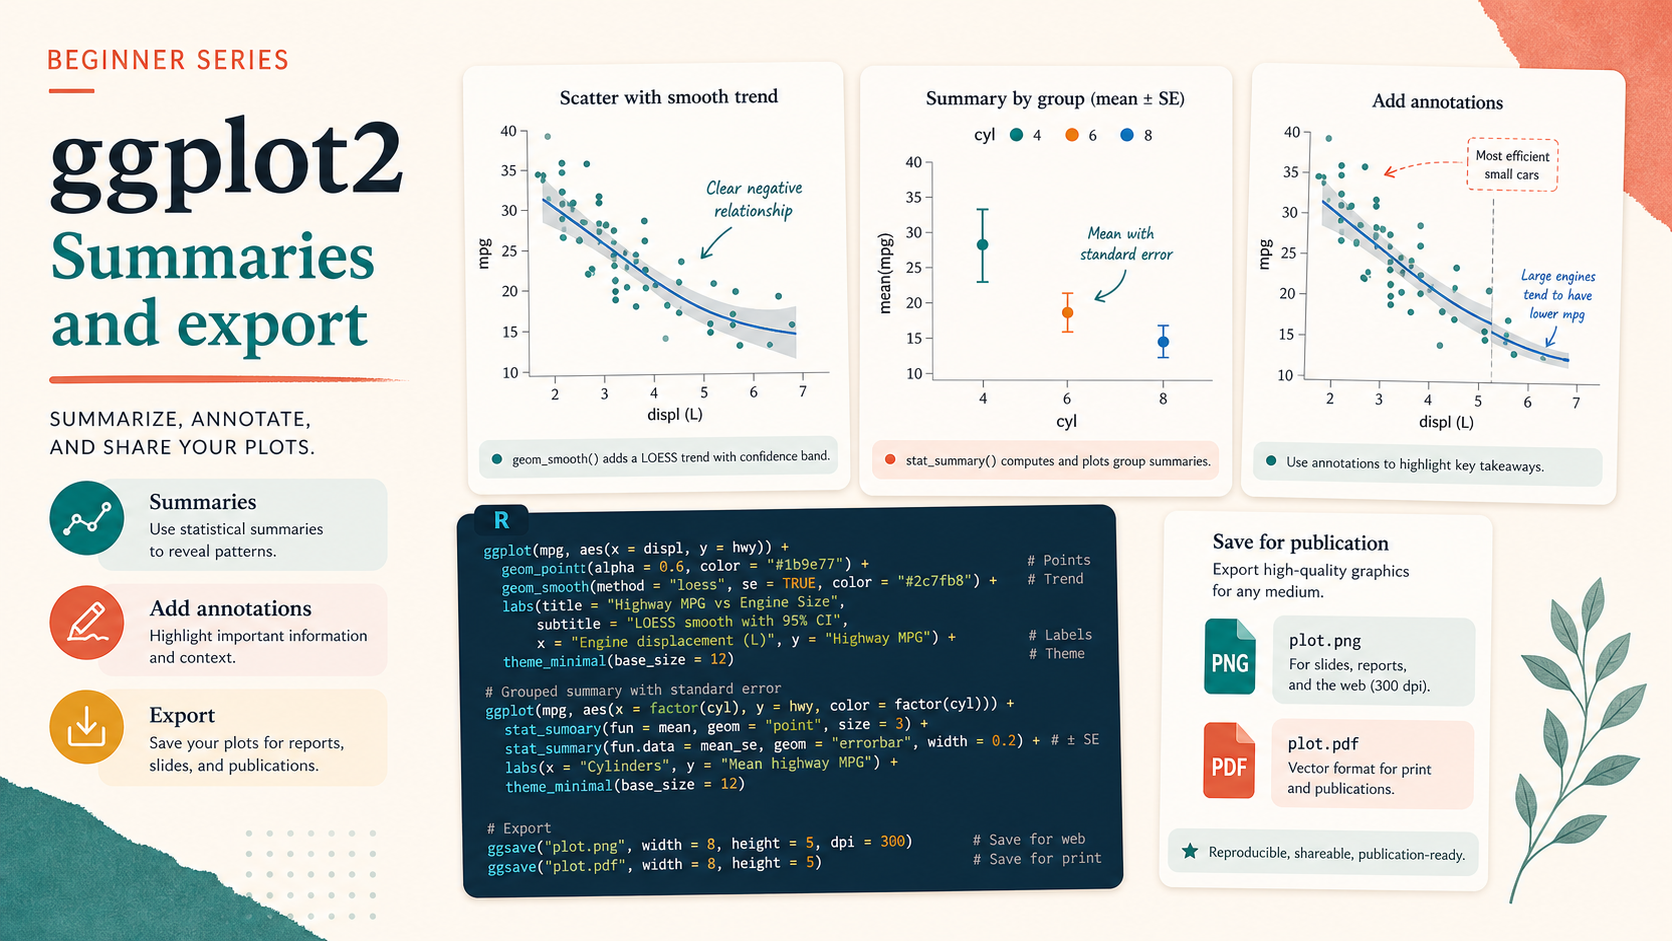
Who This Is For
This article is for readers who can already build a solid ggplot, but are not yet confident about the finishing steps that make a figure ready to share. The goal is to teach practical add-ons such as smoothing, summary layers, annotations, and export settings.
What You Will Do
- Add a trend line with
geom_smooth(). - Build a grouped summary plot with error bars.
- Highlight points or regions with annotations.
- Export figures reproducibly with
ggsave().
Before You Start
- You should already know the core ggplot workflow.
- You need
ggplot2,palmerpenguins,dplyr, andggrepel. - You should understand that export settings are part of the final figure design, not an afterthought.
The companion script for this article is:
R draw/scripts/07-ggplot-from-zero-summaries-annotations-export.R
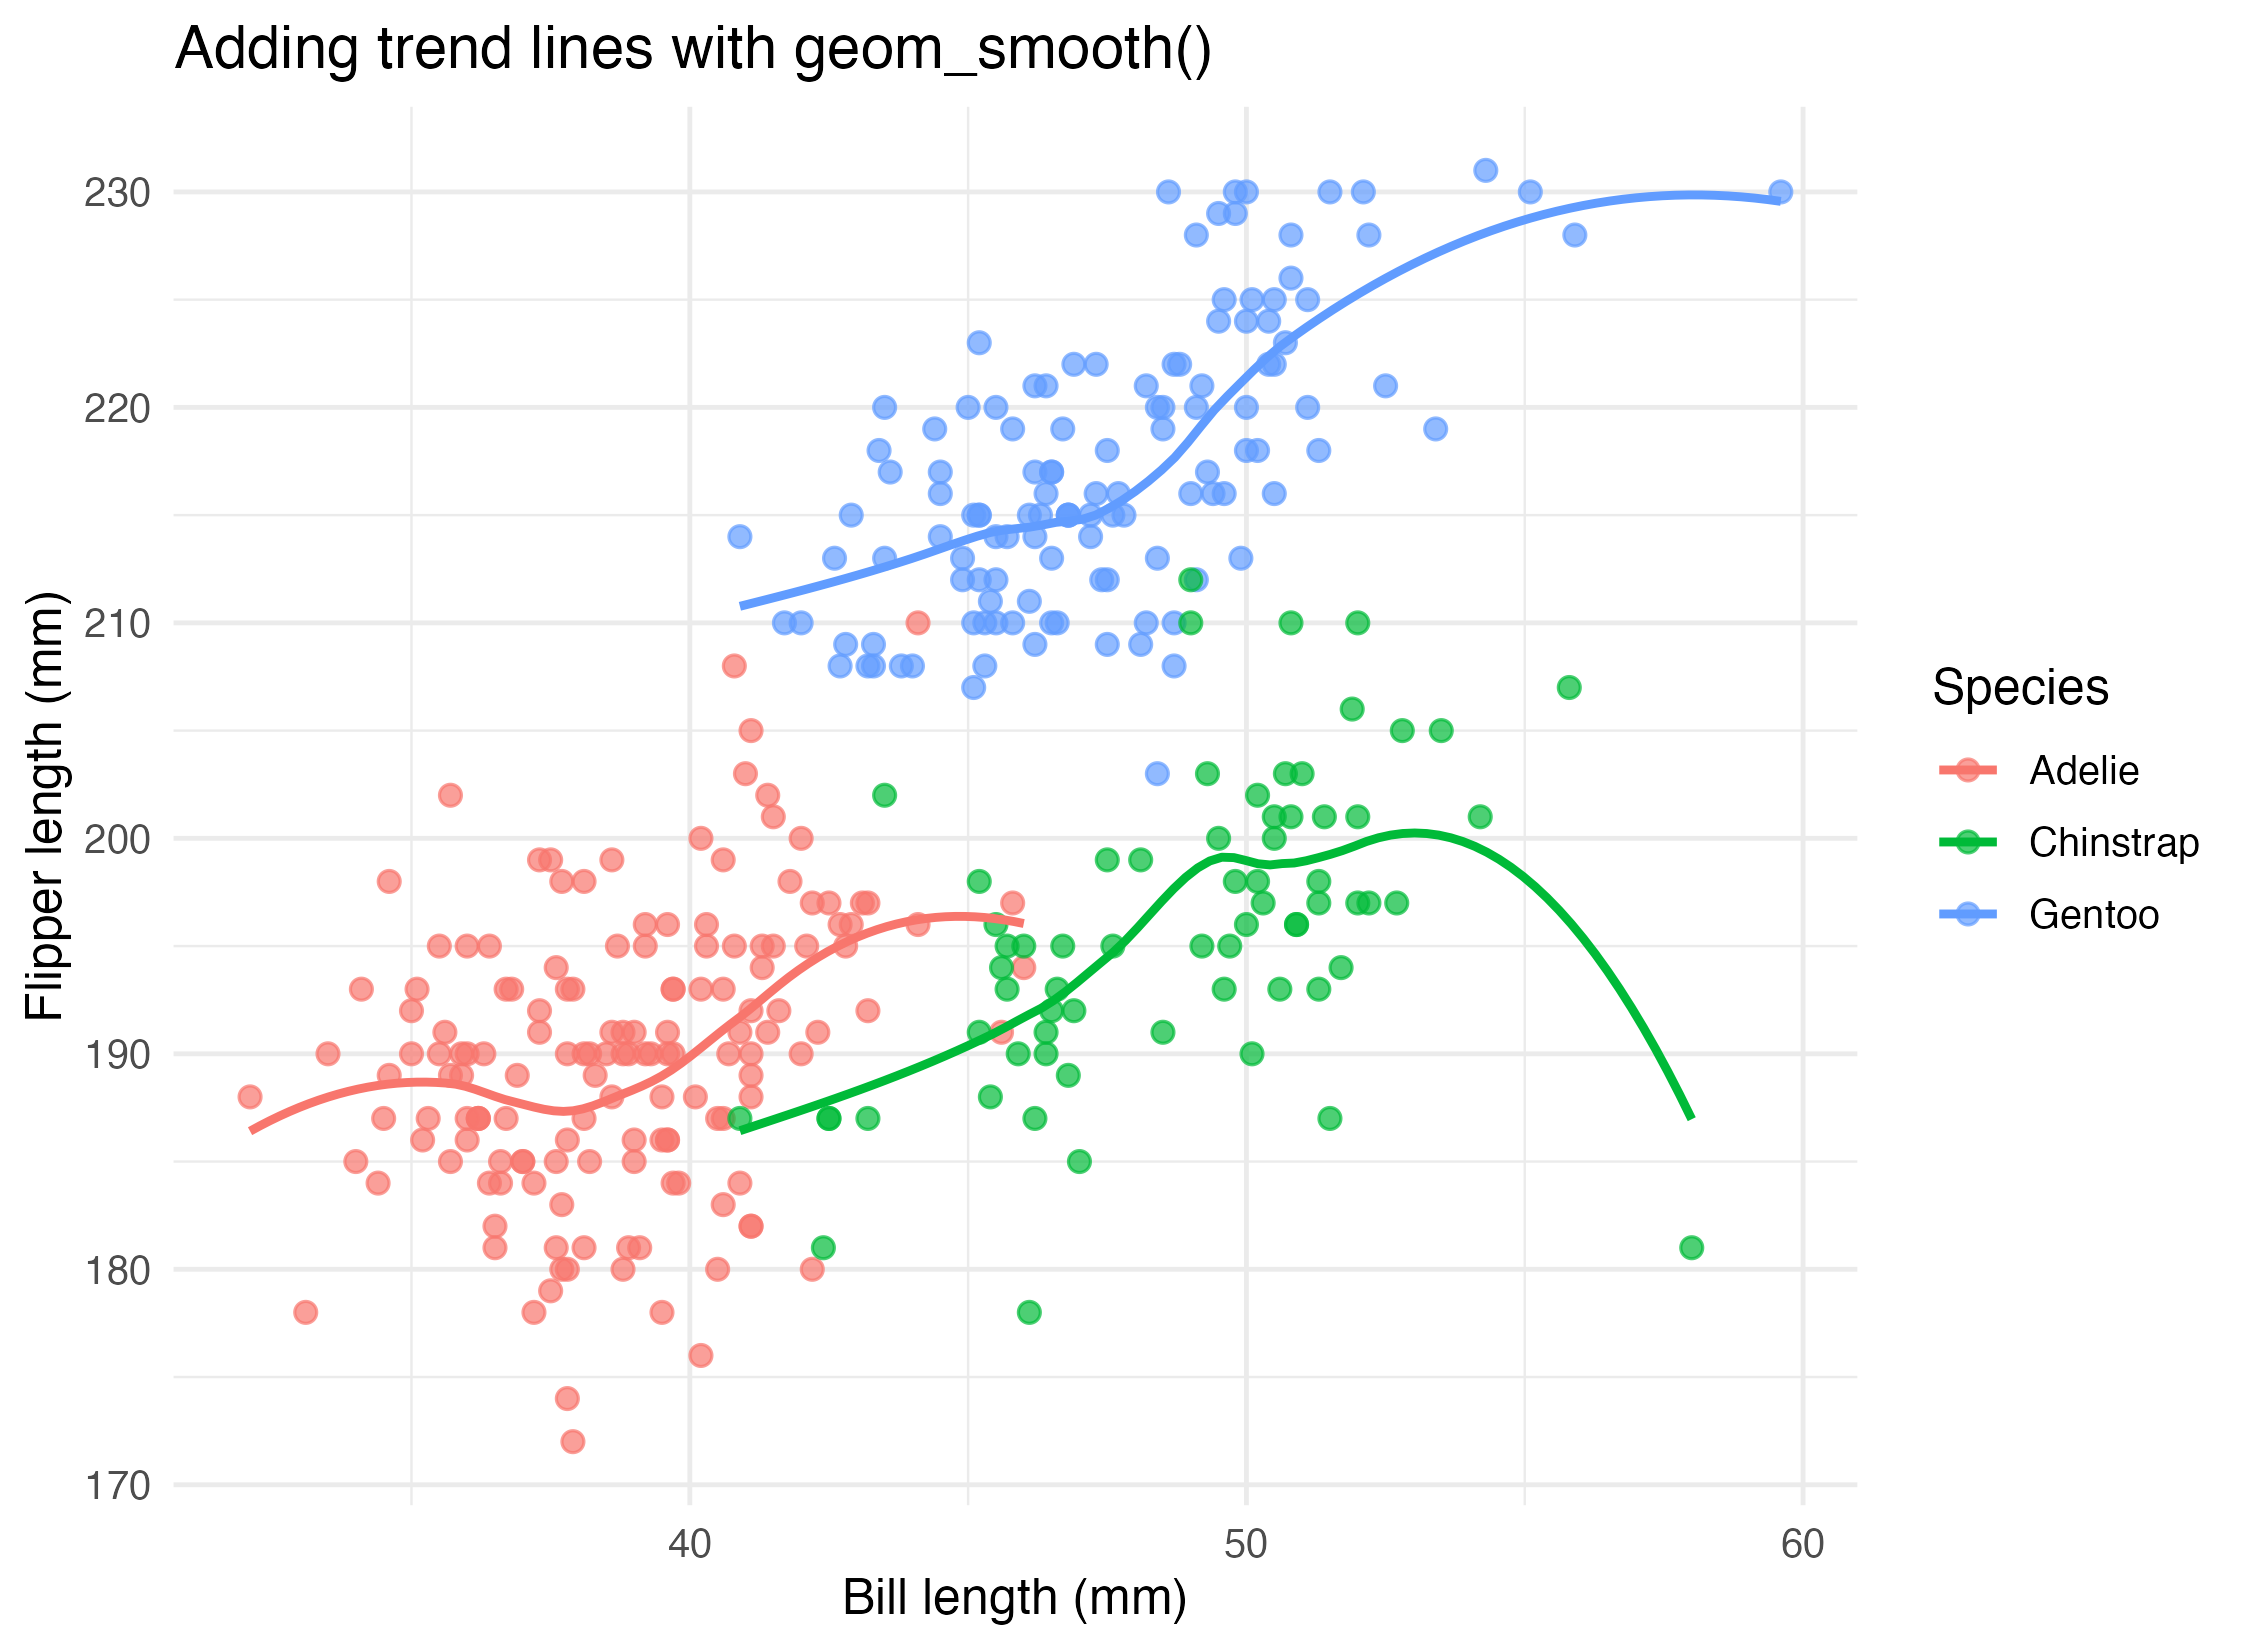
Step 1: Add a Trend with geom_smooth()
One of the fastest ways to help readers see a broad pattern is to add a smoothing layer.
ggplot(
  penguins_clean,
  aes(x = bill_length_mm, y = flipper_length_mm, color = species)
) +
  geom_point(alpha = 0.7, size = 2.1) +
  geom_smooth(se = FALSE, linewidth = 1)
geom_smooth() does not replace the original points. It adds a summary of the overall relationship.
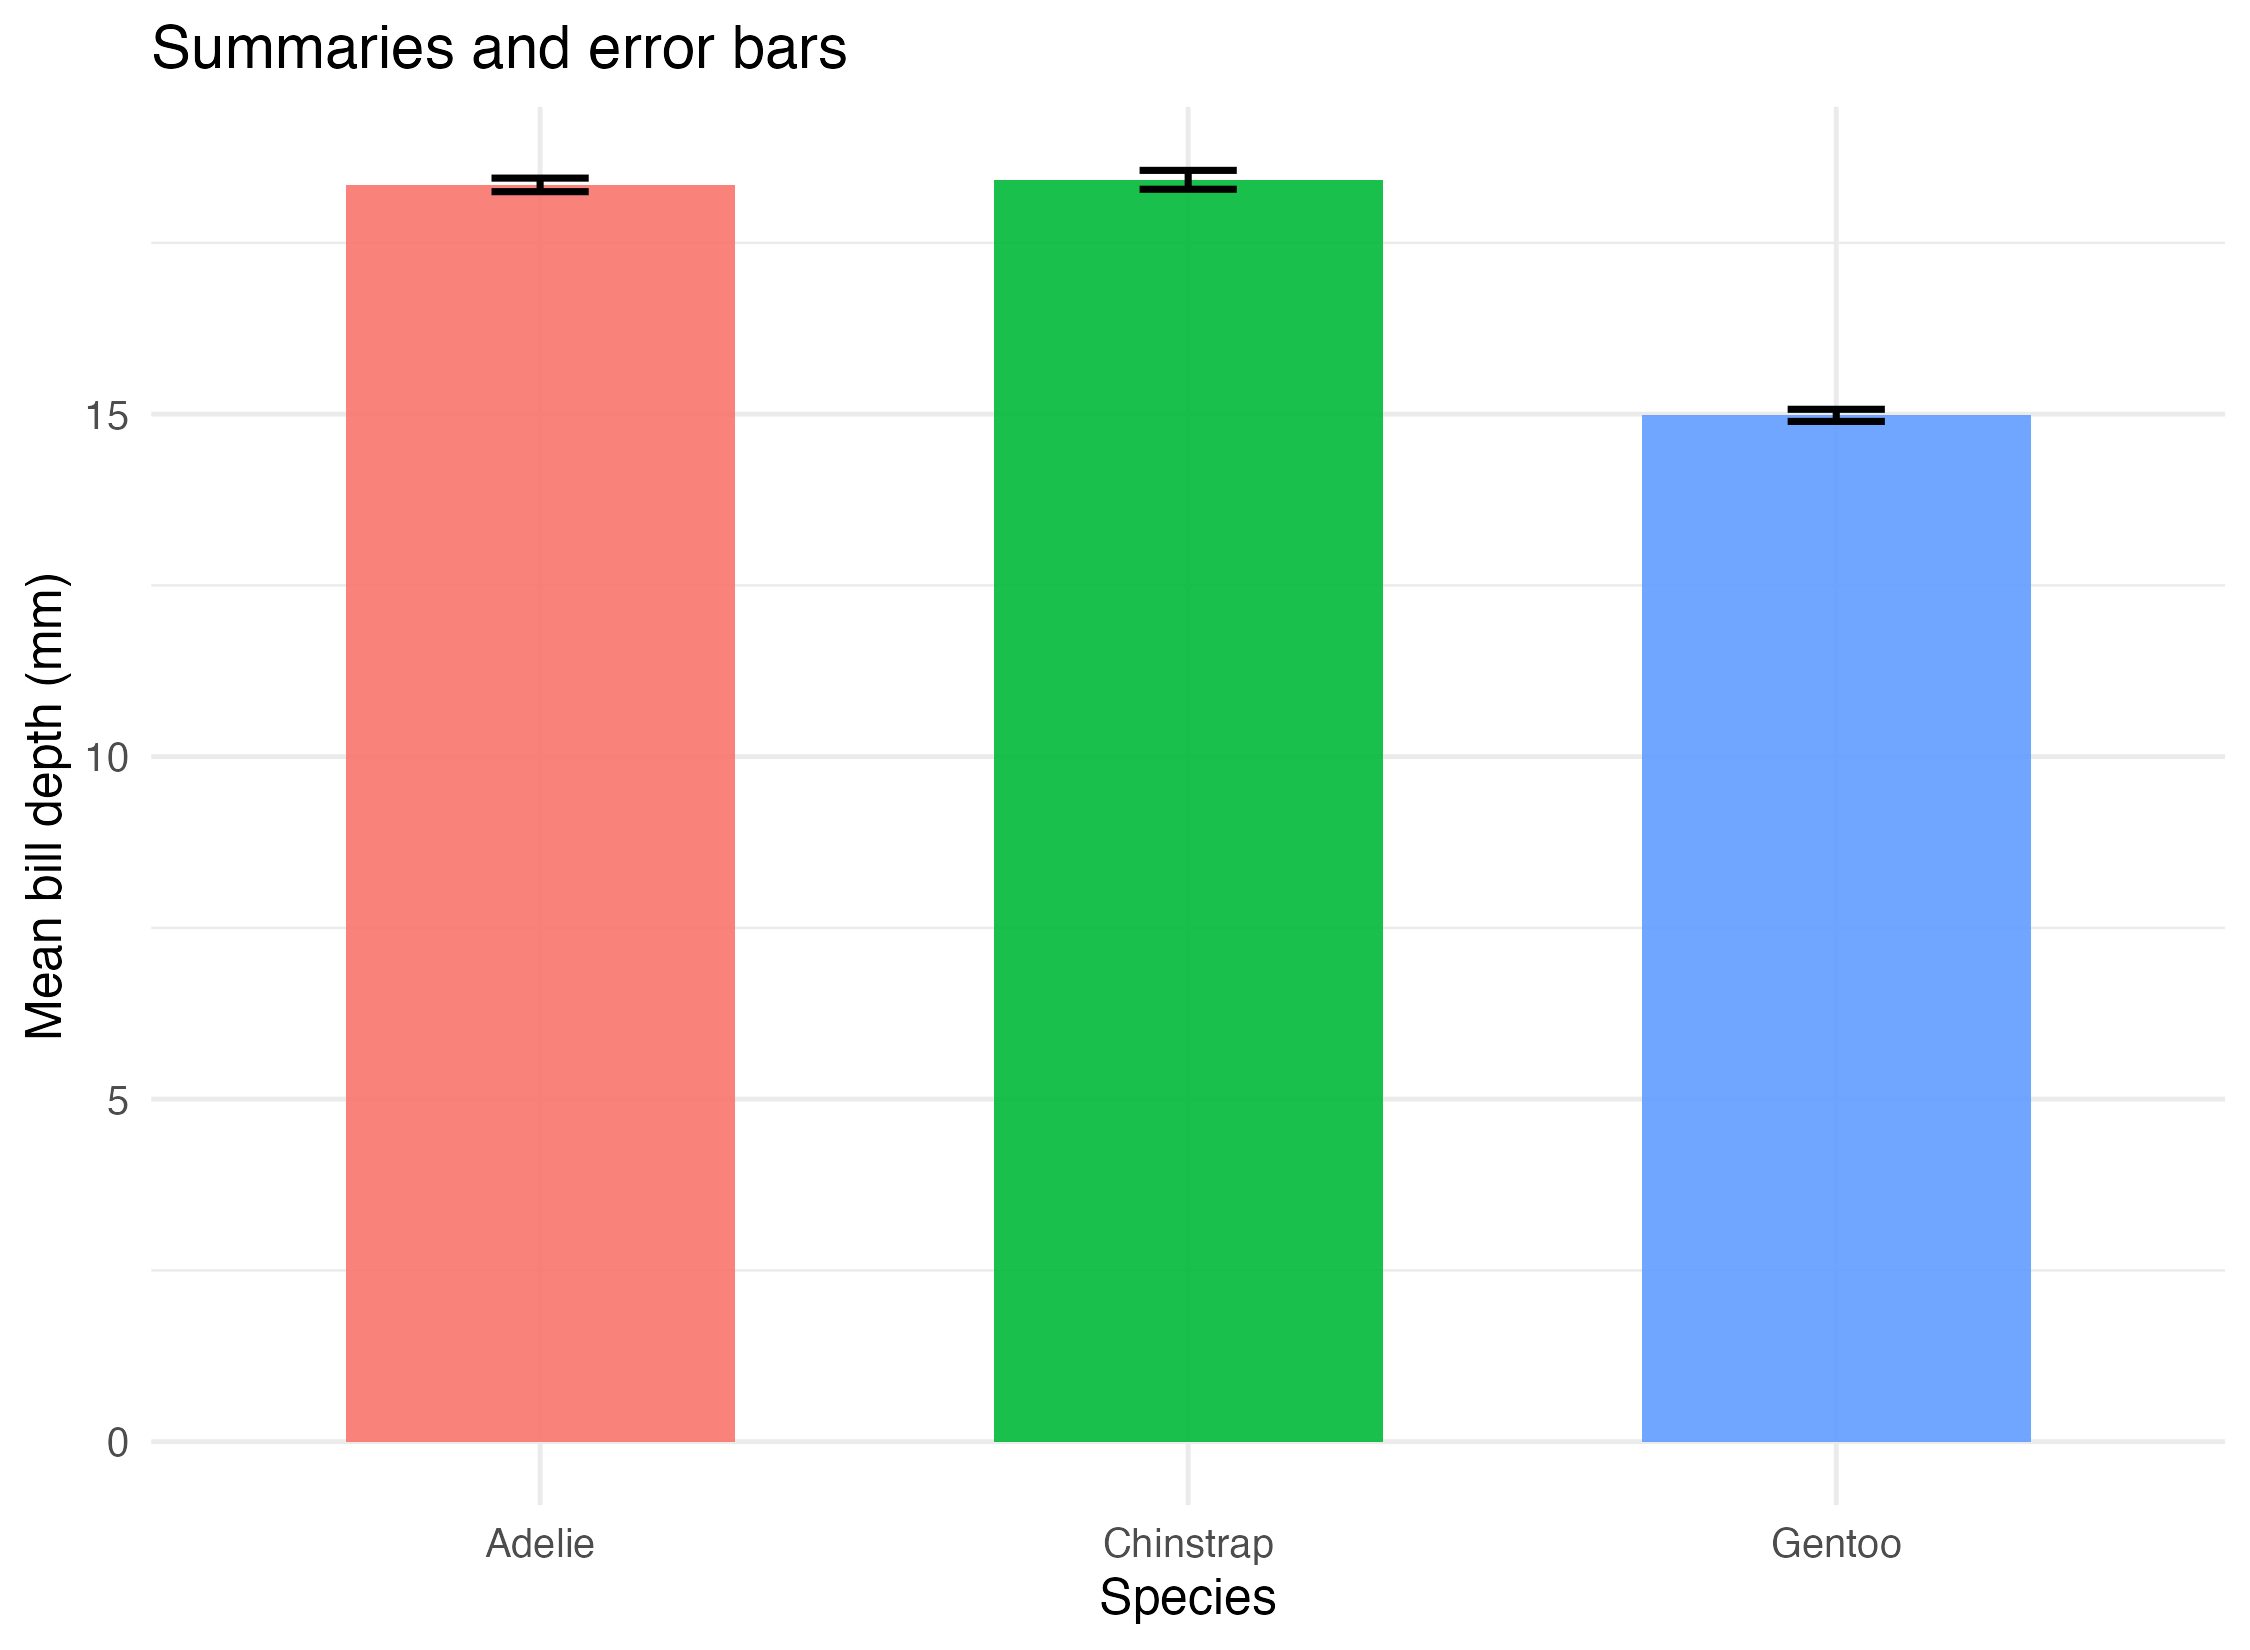
Step 2: Summarize Groups and Add Error Bars
Some plots are more useful when you show grouped summaries instead of every raw point.
geom_col(width = 0.6) +
geom_errorbar(
  aes(ymin = mean_depth - se_depth, ymax = mean_depth + se_depth),
  width = 0.15
)
This pattern works well when you want to show a group average and a simple uncertainty interval.
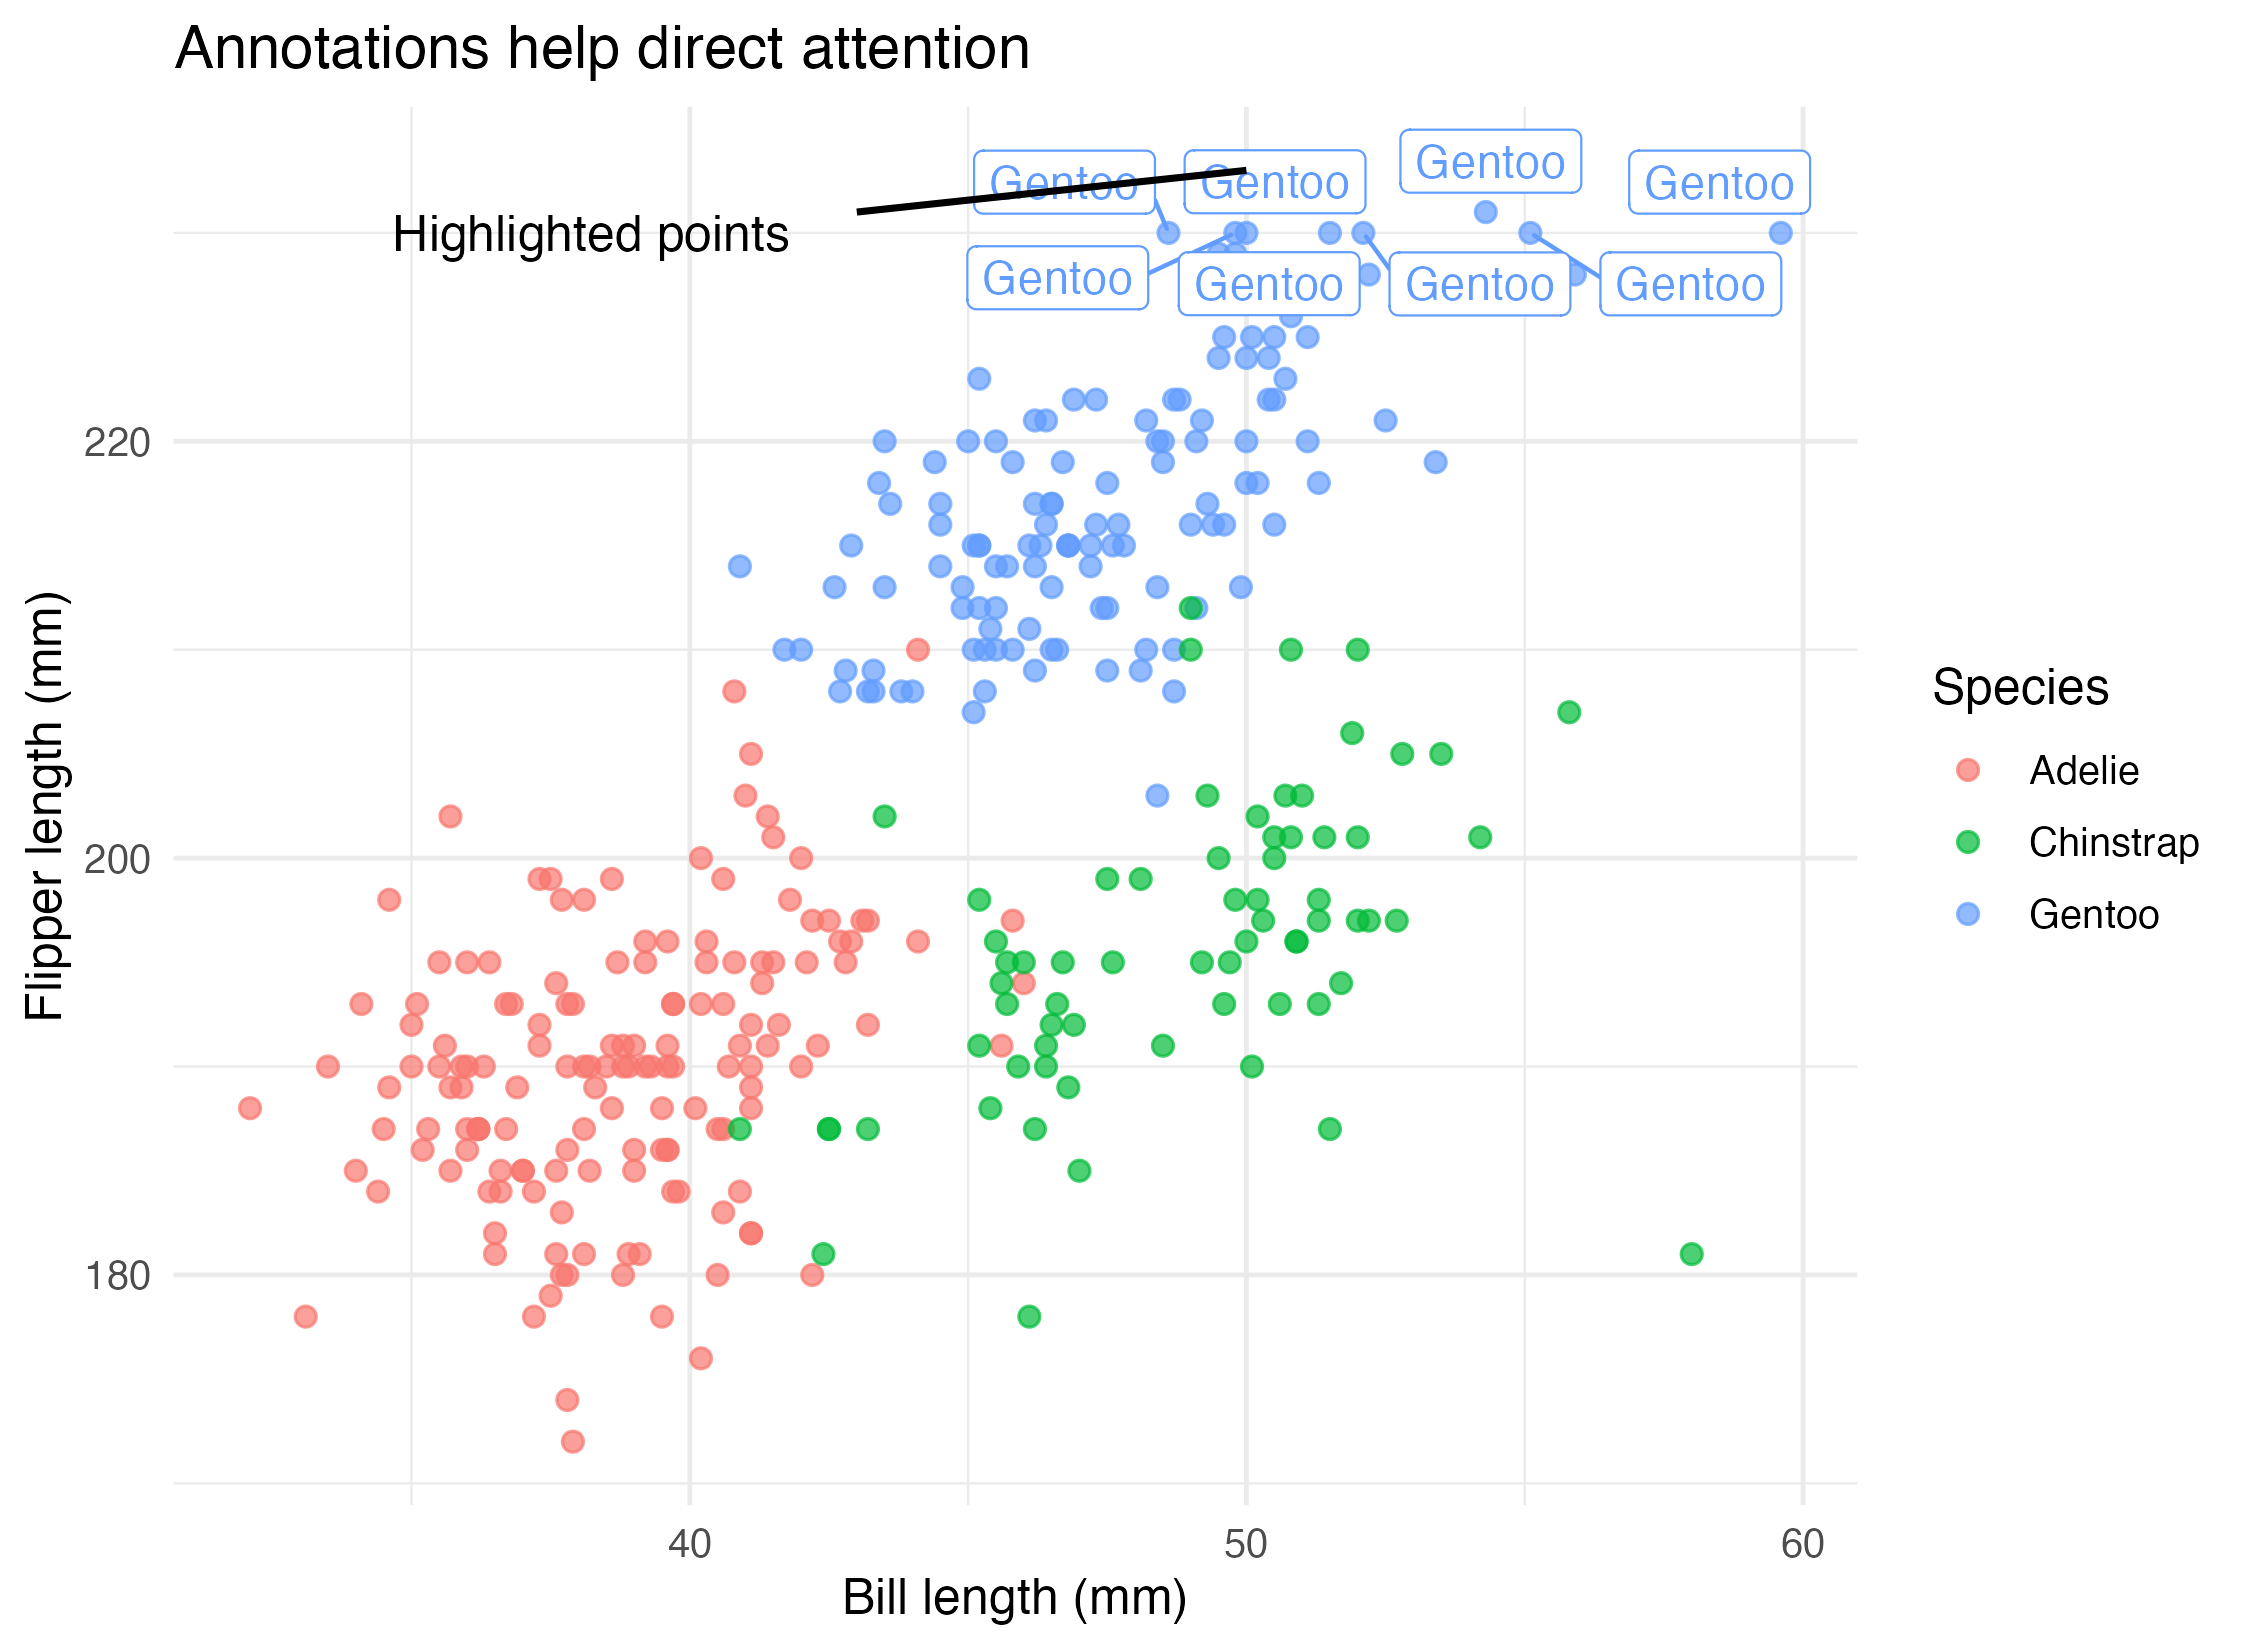
Step 3: Use Annotations to Direct Attention
Annotations are especially helpful when one or two points matter more than the rest.
geom_label_repel(...) +
annotate("segment", ...) +
annotate("text", ...)
The point is not to decorate the figure. The point is to make interpretation easier.
Step 4: Export the Figure Reproducibly
Use ggsave() when you want stable export settings:
ggsave(
  filename = "R draw/figures/07-smooth-lines.png",
  plot = plot_smooth,
  width = 7.5,
  height = 5.5,
  dpi = 300
)
Important parameters:
filenamecontrols where the file is writtenwidthandheightcontrol physical output sizedpicontrols raster sharpness
The companion script also exports a PDF version so readers can see that one plot may need more than one output format.
Show Explanation
Export Rule of Thumb
- Use PNG for blog posts, slide decks, and quick sharing.
- Use PDF when you want a vector format for print or editing workflows.
- Decide size before export. Stretching a tiny raster image later usually looks worse than exporting correctly once.
```
How to Confirm It Worked
- Your script creates:
R draw/figures/07-smooth-lines.pngR draw/figures/07-summary-error-bars.pngR draw/figures/07-annotation-example.pngR draw/figures/07-smooth-lines.pdf
- You can explain why the annotation layer is there.
- You can export one figure to both PNG and PDF without changing the plot logic.
Common Questions
Does geom_smooth() prove a real statistical relationship?
No. It helps visualize a trend, but it is still a visual summary, not a complete statistical argument.
When should I use error bars?
Use them when your audience needs a summary of spread or uncertainty and when you can explain what the interval represents.
Why not annotate everything?
Because too many annotations compete with the data. Good annotation is selective.
Review Score
Score: 94/100 Verdict: This draft is ready for human review and covers the practical finishing tools that many beginners need before they can publish a plot confidently.
Show Explanation
Score Breakdown
- Accuracy: 24/25. The article uses standard ggplot summary, annotation, and export patterns correctly.
- Beginner friendliness: 24/25. The examples stay practical and the purpose of each finishing tool is explicit.
- Reproducibility: 24/25. The script exports both figure files and a PDF example with explicit sizing.
- Professional judgment and risk handling: 22/25. The article avoids overstating what smoothers and error bars mean, which is important for beginners.
Review Notes
- Ready for human review.
- Before publication, consider one short sentence clarifying that error bars can represent different quantities in different workflows.
```
Personnel
- ✍ Creator: Chenglin Cai
- 🤖 AI Collaboration: ChatGPT
- 🧪 Data Provider: palmerpenguins dataset and derived summary data
- 💻 Code Contributor: ChatGPT