Tag: r
All the articles with the tag "r".
-
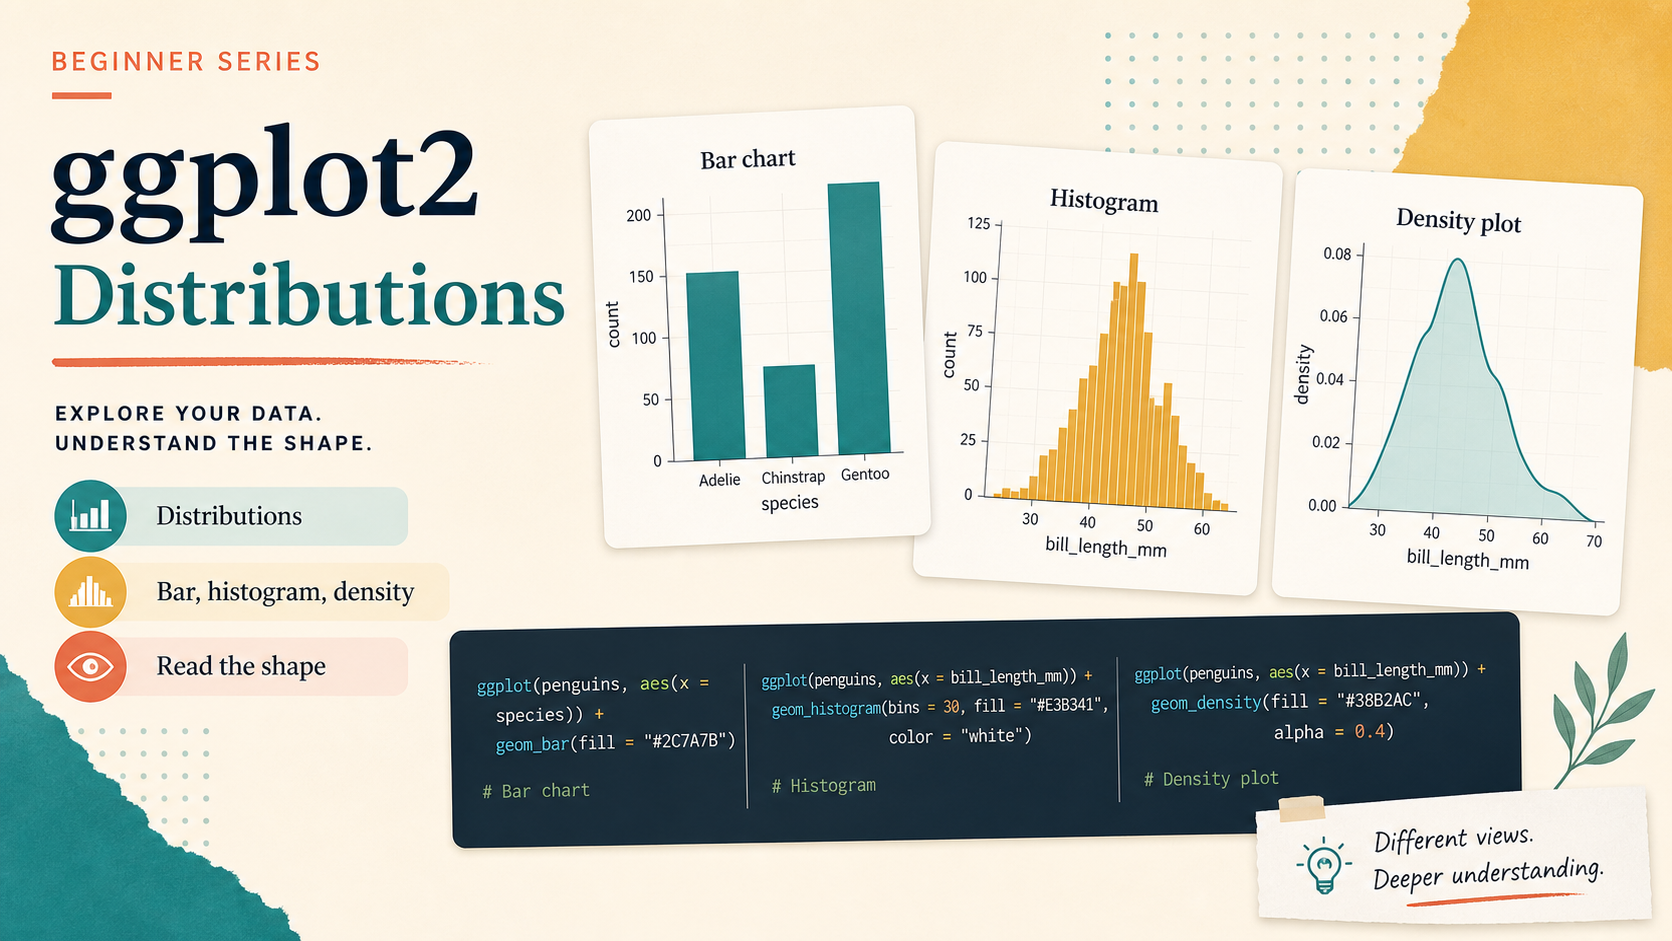
ggplot From Zero 02: Distributions
Learn how to choose between bar charts, histograms, and density plots when you want to show the distribution of one variable.
-
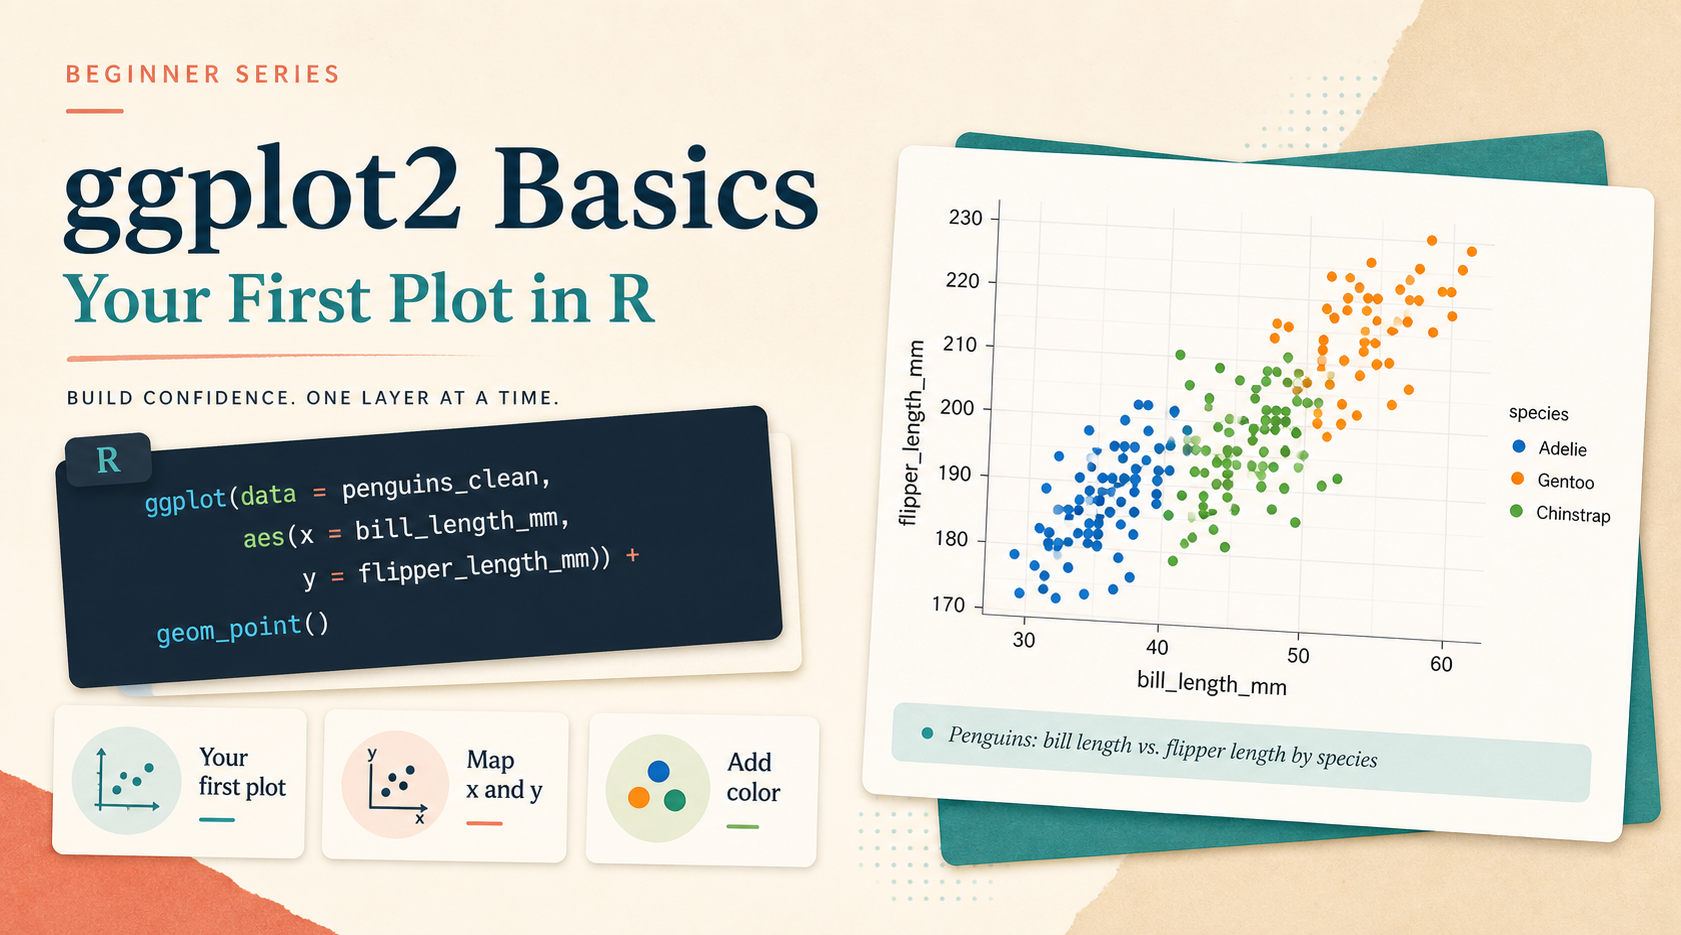
ggplot From Zero 01: Your First Plot
Learn the smallest working ggplot2 workflow by building your first scatter plot and then adding one more mapped variable.
-
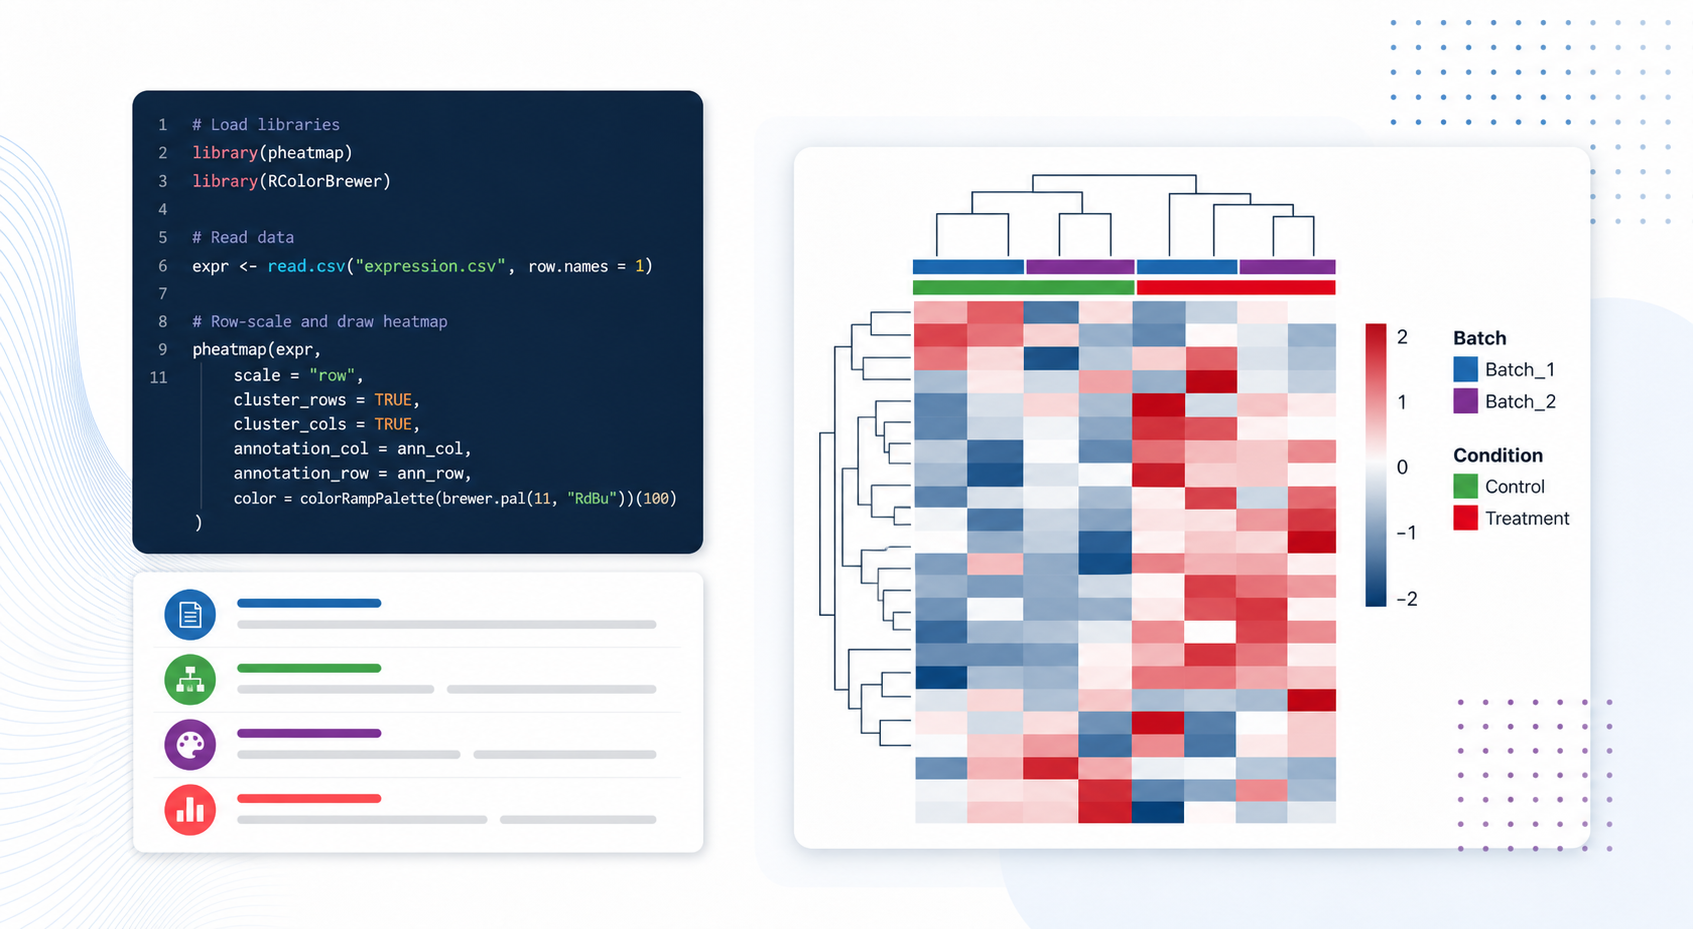
R Heatmap from Data to Display
Updated:A beginner-friendly R heatmap tutorial that shows how to generate example data, prepare annotations, build a reusable plotting function, and save the final figure.